MLB Platoon Splits: Matchup Data for Prop Betting
 Available in US
Reading Platoon Splits for MLB Prop Odds
Early in my prop career, I noticed something odd: the same hitter’s strikeout prop would sit at 0.5 in one game and jump to 1.5 in the next, even though both opponents seemed similar on paper. The variable I was missing was handedness. The first game featured a right-handed starter against a right-handed batter; the second featured a left-handed starter against the same batter, who historically struggled with southpaws. Once I started filtering by platoon splits, the market made a lot more sense — and I found edges where I had seen only noise.
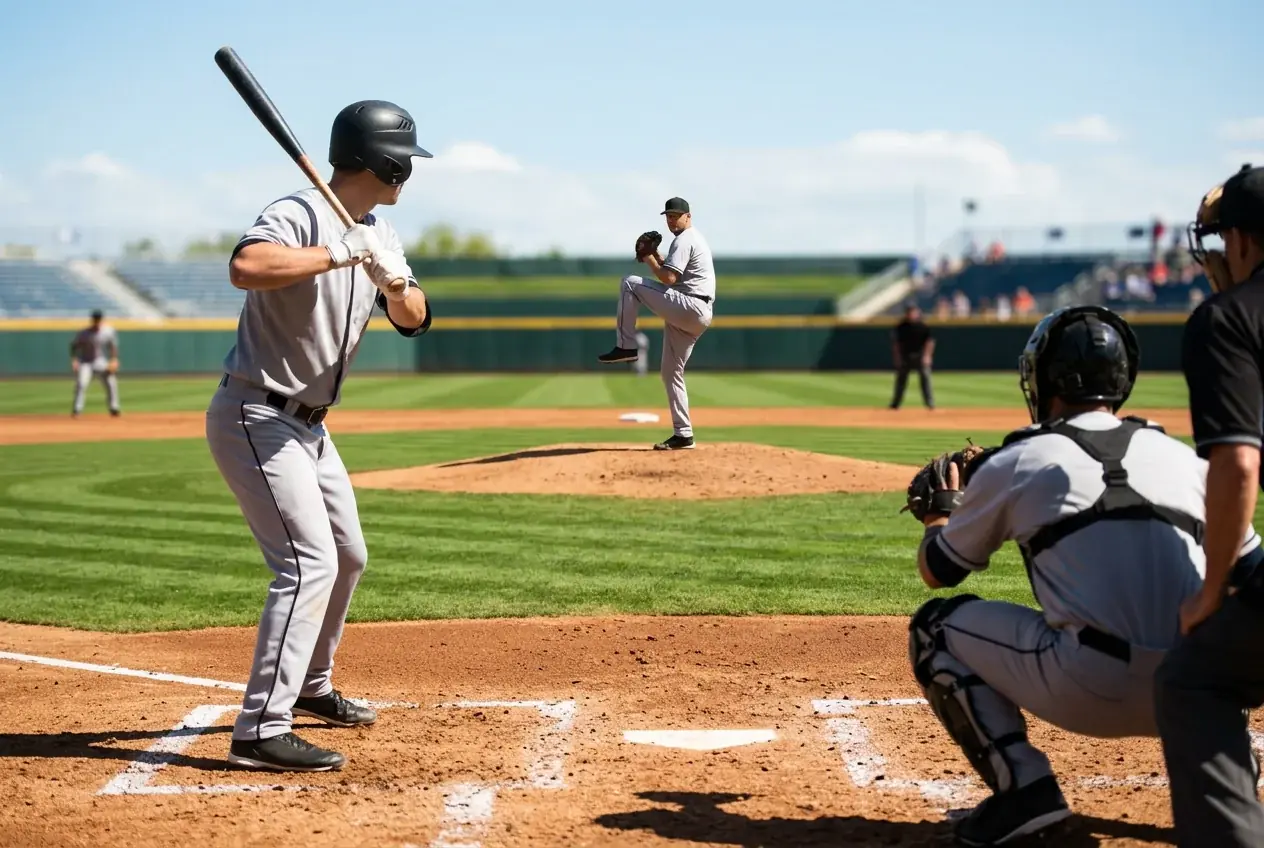
Platoon advantage — the tendency for batters to perform better against opposite-handed pitchers — is one of the oldest principles in baseball. Right-handed hitters generally hit better against left-handed pitchers, and left-handed hitters generally hit better against right-handed pitchers. The reason is partly mechanical (the ball moves into the hitter’s line of sight rather than away from it) and partly about pitch-type exposure (breaking balls from same-side pitchers move away from the hitter, expanding the effective strike zone). Sportsbooks know this and factor it into their prop lines, but their models use season-long split averages that do not always capture the full magnitude of a specific hitter’s platoon differential.
Batter Platoon Differentials and What They Predict
Not all hitters have equal platoon splits. Some hitters rake regardless of pitcher handedness; others show massive differentials that transform them from above-average hitters into below-average ones depending on the matchup.
The metric I track is wRC+ by handedness — weighted runs created plus, split by whether the opposing pitcher throws left or right. A hitter with a wRC+ of 130 against right-handers and 85 against left-handers has a 45-point platoon differential. That gap represents a fundamentally different hitter depending on the matchup, and his prop line should reflect it. Most of the time the line does reflect it, but the adjustment is often conservative — weighted toward the season aggregate rather than the full split differential.
Where the edge appears is in the extremes. A hitter with a 60-point platoon differential — elite against righties, poor against lefties — might see his hits prop line adjusted from 1.5 to 0.5 when facing a lefty, but the odds on the under might still imply a probability that is lower than the split data suggests. The book knows the hitter is worse against lefties but may not fully price in how much worse, particularly if the hitter has been on a recent hot streak that inflates his aggregate numbers and masks the split weakness.
I keep a running list of hitters with the largest platoon differentials — those with 40+ point gaps in wRC+ between left-handed and right-handed opponents. When one of these hitters faces his weak-side matchup, his prop lines become my first targets for the day. The key is not to assume the book has missed the split entirely — it has not — but to check whether the book has priced the full magnitude of the differential or only a portion of it.
Pitcher Platoon Vulnerability: When Handedness Matters Most
Platoon splits work in both directions. Just as batters perform differently against left-handed and right-handed pitching, pitchers perform differently against left-handed and right-handed lineups. And the magnitude of that difference varies enormously from one pitcher to the next.
A right-handed pitcher who relies heavily on a slider — a pitch that sweeps away from right-handed hitters but breaks into left-handed hitters — is often far more effective against same-side batters. His strikeout rate against righties might be 28% while his strikeout rate against lefties drops to 19%. That 9-percentage-point gap means his strikeout prop should be lower against a lineup stacked with left-handed bats, but the line adjustment depends on the book’s model correctly weighting the current lineup composition rather than using a league-average split.
The flip side is equally exploitable. Left-handed pitchers who throw a changeup as their primary off-speed weapon often have minimal platoon vulnerability because the changeup is equally effective against both sides. These pitchers maintain relatively stable strikeout and contact rates regardless of the opposing lineup’s handedness, which means their prop lines should not move much based on the matchup. When a book over-adjusts a left-handed changeup artist’s strikeout line against a right-handed-heavy lineup — presumably because the model applies a generic “lefty vs righties” penalty — the under on the adjustment can carry value.
The practical research step is to check the starting pitcher’s pitch-mix splits by batter handedness. If his primary out pitch is effective against both sides, the platoon effect is muted. If his primary out pitch is handedness-dependent — like a sweeper that only works against same-side hitters — the platoon effect is amplified. This distinction is available on Baseball Savant’s pitch-arsenal page for every pitcher in the league.
Sample-Size Traps in Split Data
Platoon splits are real, but small samples make them dangerous. This is the caveat that separates responsible split analysis from reckless over-fitting, and only 3-5% of sports bettors manage to stay on the right side of it.
A hitter might show a .400 batting average against left-handed pitching through April, but if that number is based on 20 plate appearances, it is noise dressed up as signal. Sample-size thresholds for split data are higher than most bettors realise. I require a minimum of 100 plate appearances against a specific handedness before I trust the split data as predictive rather than descriptive. Below that threshold, the data tells you what happened; above it, the data starts to tell you what is likely to happen going forward.
Early in the season — April through mid-May — the current-year split samples are too small to be reliable on their own. I supplement them with the prior season’s splits, blending the two at roughly 50/50 weight. By July, the current-season sample is typically large enough to stand alone for everyday players. For bench players, platoon specialists and injury-return cases who have accumulated fewer plate appearances, the blending approach may need to extend through August.
The other sample-size trap is over-specifying. “This hitter against left-handed sliders in the top of the zone” is a filter that produces tiny samples with extreme outcomes. Every additional filter you apply reduces the sample and increases the noise. The discipline is to keep the filters broad enough that the sample retains statistical meaning: hitter vs left-handed pitching, full stop. Resist the urge to sub-filter into specific pitch types or zones unless the sample exceeds 200 plate appearances, which most hitter-level splits never reach within a single season.
Platoon data is one of the most reliable edges in MLB prop betting when used with appropriate sample sizes and an awareness of its limitations. It is also one of the most commonly misused tools, generating false confidence from small samples that revert to the mean by June. The bettor who respects the threshold — 100 plate appearances minimum, blended with prior-season data early in the year — will extract far more value from splits than the one who chases a .450 average built on 15 at-bats against lefties in April. The same caution applies to pitcher strikeout splits, where handedness-driven edges are real but only reliable once the sample supports them.
How large a sample size do platoon splits need before they become reliable for prop betting?
A minimum of 100 plate appearances against a specific handedness is the threshold where split data transitions from descriptive to predictive. Below that number, the results are too noisy to anchor a prop bet. Early in the season, blend the current year’s small sample with the prior season’s splits at roughly 50/50 weight until the current-year data is large enough to stand alone, typically by mid-June for everyday players.
Do switch-hitters eliminate the platoon advantage in prop analysis?
Switch-hitters reduce the platoon advantage but do not eliminate it entirely. Most switch-hitters have a stronger side — they hit better from one side of the plate than the other — and their overall platoon differential is smaller but rarely zero. Check the switch-hitter’s split data from each side independently. Some switch-hitters are elite from the left side but merely average from the right, which means the platoon effect is muted against right-handed pitching but still present against left-handed pitching.
Written by the editors at mlb bet Props.