MLB Total Bases Props: Contact Rate and Odds
 Available in US
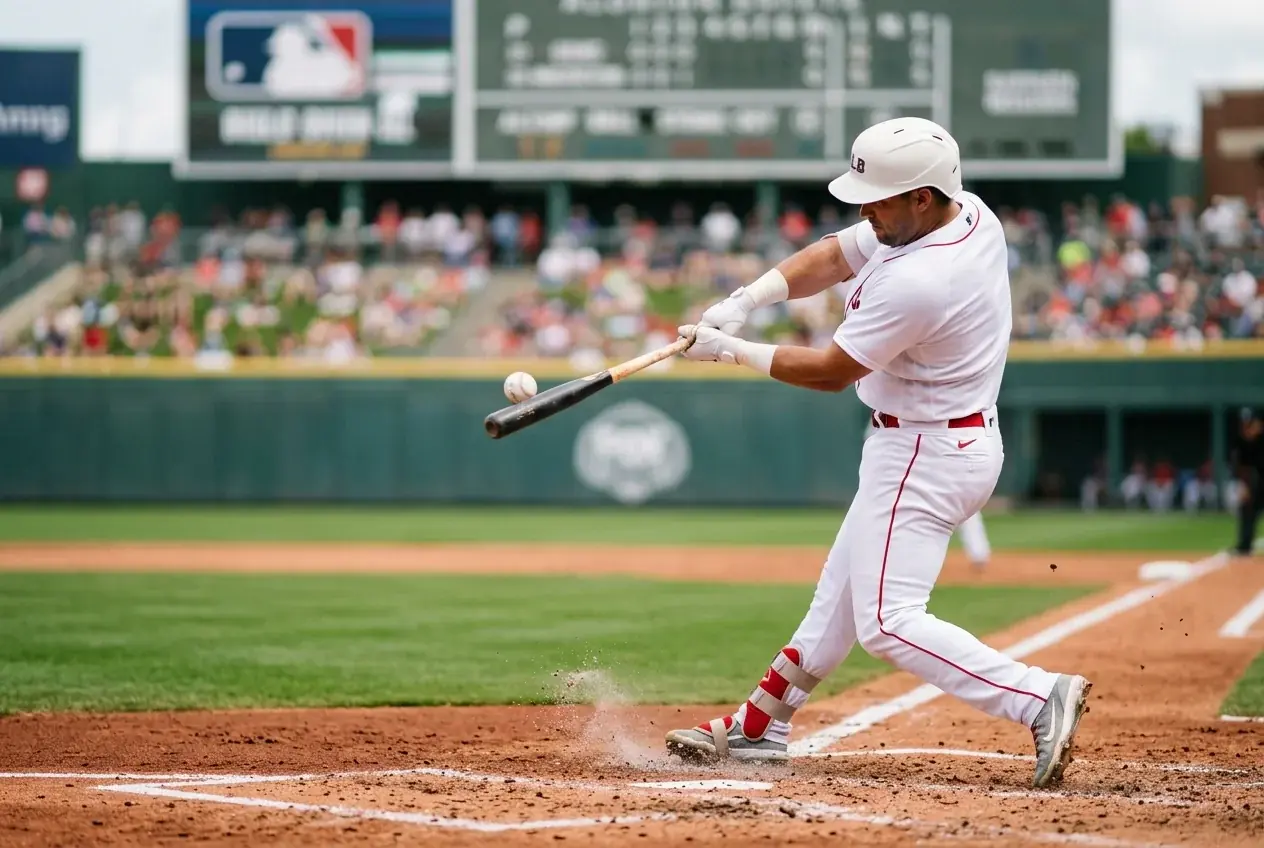
Analyzing Hard-Hit Data for Total Bases Props
I spent the first two years of my prop career chasing home run bets before I realised the steadiest returns were sitting one market over. Total bases props are the workhorses of the MLB player prop sheet — less glamorous than a homer wager, more consistent than a hits line, and far more forgiving of the variance that turns a good month into a brutal one. The reason is structural: a total bases prop captures every type of offensive production in a single number. A single counts as one base, a double as two, a triple as three and a home run as four. Even a batter who goes 1-for-4 with a double clears a 1.5 line. That breadth of qualifying outcomes is exactly what makes this market so appealing for systematic bettors.
Player props now account for roughly 70-75% of all same-game parlay bets, and total bases lines sit at the core of that trend. Six of the top seven most popular SGP markets revolve around individual player performance, so sportsbooks devote serious modelling resources to these lines. That means the prices are tight — but not unbeatable. The edge, as with most prop markets, lives in the gap between what the line implies and what the underlying data actually says about a hitter’s next game.
Where home run props hinge on a binary event — the ball either leaves the yard or it does not — total bases props reward sustained quality contact. A hard line drive into the gap, a ground ball that sneaks through, a wall-scraping double: all of these count. That shift from a single high-variance event to a spectrum of positive outcomes is why I tell newer bettors to start here before graduating to the flashier markets.
Why Contact Rate Beats Batting Average for Total Bases
Three seasons ago I built a simple model that ranked hitters by batting average and used it to filter total bases overs. The results were mediocre. Then I swapped the primary input from batting average to contact rate — the percentage of swings that make contact with the ball — and the hit rate on my selections jumped noticeably within a single month. The lesson was clear: batting average is a lagging indicator contaminated by luck on batted balls. Contact rate tells you whether the hitter is actually putting the bat on the ball, which is the first prerequisite for accumulating bases of any kind.
A hitter who carries an 82% contact rate will generate more plate appearances with a ball in play than one sitting at 74%, regardless of what their respective batting averages happen to show over a two-week window. Batting average includes outcomes influenced by defensive positioning, BABIP variance and park dimensions. Contact rate strips all of that away and isolates the skill component — the batter’s ability to make the bat meet the ball. For a total bases prop, that skill is the foundation everything else sits on.
The practical application is straightforward. When I evaluate a total bases line, the first metric I pull is the hitter’s season contact rate, then their rolling 15-game contact rate. If the rolling number has dipped significantly below the season mark, I look for a mechanical explanation: is the hitter chasing more pitches outside the zone, or is the swing-decision rate stable but the whiff rate climbing on pitches inside the zone? The former is correctable and often corrects itself. The latter suggests a timing issue that may take longer to resolve. In either case, contact rate gives me a faster read on a hitter’s true offensive process than the traditional stats ever could.
Hard-Hit Rate and Expected Slugging as Predictors
Contact alone is not enough. A batter can make contact on 85% of swings and still produce nothing but weak grounders to the shortstop. That is where hard-hit rate enters the picture — the share of batted balls with an exit velocity of 95 miles per hour or greater. Hard-hit rate measures the quality of contact, not just the quantity. A hitter sitting at 45% hard-hit rate is squaring up nearly half of everything he puts in play at damaging speed, and those batted balls are far more likely to result in extra-base hits than a softly struck grounder.
Expected slugging — xSLG — takes the concept further by modelling what a hitter’s slugging percentage should be based on exit velocity and launch angle data, stripping out the noise of defensive positioning and park quirks. When a hitter’s actual slugging percentage lags well behind his xSLG, you are often looking at a player whose results are about to catch up with his process. That gap is where total bases prop value hides. Sportsbooks set lines based on a blend of recent results and projections, but they weight the results more heavily than many bettors realise. When a hitter’s xSLG says 0.520 but his actual SLG reads 0.430, the book’s line tends to sit closer to the 0.430 reality, leaving room for the bettor who trusts the process data.
I combine hard-hit rate with contact rate into a simple composite: multiply the two together and you get a rough proxy for “quality contact frequency.” A hitter with 80% contact rate and 42% hard-hit rate produces a composite of 0.336. One with 78% contact and 48% hard-hit rate scores 0.374. The second hitter is generating fewer total contacts but more damage per contact, which for total bases props — where a double counts twice as much as a single — makes him the stronger candidate on a per-plate-appearance basis. This composite is crude, and I would never claim it replaces a proper model, but as a screening tool for daily prop sheets it saves me time and keeps me focused on the right players.
Lineup Spot and Plate-Appearance Volume
A hitter who sits seventh in the order and faces a team that works deep counts against a methodical starter might only get three plate appearances before the bullpen takes over. The same hitter batting third in a high-scoring game environment might see five trips to the plate. That volume difference is enormous for total bases props, and it is the single easiest factor to overlook.
MLB generates more than 12 billion dollars in annual revenue, and part of that commercial machine is a 162-game regular season that produces wildly different game environments from one day to the next. A Tuesday afternoon getaway game with a 12:35 start might feature a compressed lineup with bench players slotted into the six and seven holes. A Friday night divisional rivalry could see the full-strength order stacked from top to bottom. Lineup position determines plate appearances, and plate appearances determine how many chances a hitter gets to accumulate bases.
My routine before placing any total bases wager starts with checking the projected lineup card — most beat reporters post them on social media about 90 minutes before first pitch. If my target hitter has moved from the three-hole to the six-hole, I re-evaluate. The line might not have adjusted, but the expected number of plate appearances has dropped, and that drop directly compresses the probability distribution for total bases. Conversely, when a hitter who usually bats fifth gets bumped to the two-hole because of a rest day elsewhere in the order, the additional plate appearance creates a small but genuine edge on the over side of the line. Volume is not a glamorous variable, but in a market built on cumulative outcomes it is one of the most reliable.
The other volume consideration is game total. When the implied run total for a game sits above nine, every hitter in both lineups benefits from increased scoring chances. When it sits below seven, the environment favours pitching, and total bases overs become harder to clear. I do not use the game total as a primary filter, but I use it as a final check: if everything else lines up but the game total is suppressed, I either pass or reduce my stake. The market rewards patience, and total bases props offer enough daily volume across a full MLB slate that skipping one game is never a problem.
Total bases will never generate the social-media screenshots that a four-leg home run parlay does. But if your aim is to build a repeatable home run prop and total bases process, start with contact rate, layer in hard-hit quality, check the lineup card and let the volume do the rest.
Why is contact rate more predictive than batting average for total bases props?
Batting average is a lagging indicator influenced by defensive positioning, BABIP variance and park effects. Contact rate isolates the hitter’s core skill of putting the bat on the ball, which is the prerequisite for accumulating any bases. A hitter with a high contact rate generates more balls in play per game, creating more opportunities for singles, doubles and beyond — the building blocks of a total bases prop.
How does a hitter’s lineup position influence their total bases prop line?
Lineup position determines the expected number of plate appearances. A hitter batting second or third typically gets 4-5 trips to the plate, while a seventh-place hitter might only manage 3-4. More plate appearances mean more chances to accumulate bases. Books set lines partly based on projected volume, but late lineup changes — posted roughly 90 minutes before first pitch — sometimes create value when the line has not yet adjusted.
Written by the editors at mlb bet Props.