
Closing Line Value for MLB Props: Performance Tracking
 Available in US
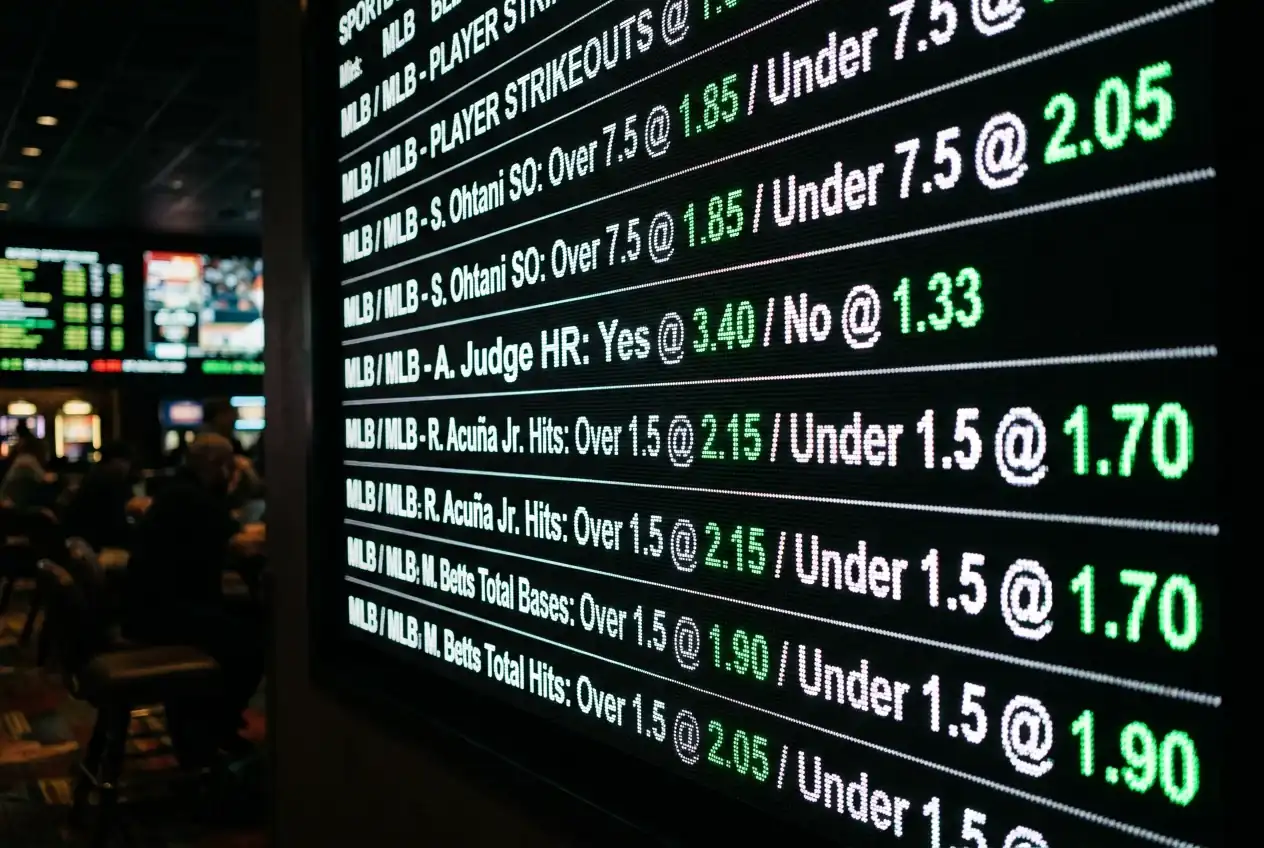
Tracking Closing Line Value for MLB Prop Odds
In my third year of prop betting, I had a month where I won 58% of my bets. Excellent, right? Then I checked my closing line value and discovered it was negative. I had been placing bets at prices that were worse than the closing line more often than not — winning through short-term variance rather than genuine edge. The next month, the variance corrected and my win rate dropped to 49%. My CLV had told me the truth; my results had been lying.
Closing line value is the most honest measure of a bettor’s skill, and it is the metric that separates sustainable winners from lucky streaks. The concept is straightforward: did you place your bet at better odds than the price available when the market closed? If you consistently get better prices than the closing line, you are identifying value before the market catches up. If you consistently get worse prices, you are arriving late and paying more than the market ultimately determines the bet is worth.
What Closing Line Value Means for Prop Bettors
The closing line is the final odds available on a prop just before the game begins. It represents the market’s most informed estimate of the true probability, because it incorporates all of the information that has entered the market throughout the day: sharp action, lineup announcements, weather updates, injury news and late money.
If you placed a strikeout over at 1.95 in the morning and the closing line on the same bet was 1.80, you captured positive CLV — you got a better price than the market’s final assessment. The market moved toward your position, which means either sharp bettors agreed with your evaluation (and their action pushed the line) or new information confirmed what your analysis suggested. Either way, you were ahead of the market.
If you placed the same bet at 1.80 and the closing line was 1.90, you have negative CLV — you paid more than the final price, suggesting you over-estimated the probability of the over relative to the market’s consensus. That does not mean the bet was wrong on this specific occasion, but over hundreds of bets, consistently negative CLV predicts long-term losses regardless of short-term win rates.
To break even at standard -110 odds, a bettor needs a win rate of 52.38%. CLV does not directly tell you your win rate, but it tells you something more important: whether the prices you are getting are good enough to sustain profitability. A bettor who captures an average of 3% positive CLV across 500 bets is almost certainly profitable, even if individual months show variance. A bettor with 3% negative CLV is almost certainly losing, even if individual months look strong.
How to Track CLV Across Your MLB Prop Bets
Tracking CLV requires recording two pieces of information for every bet: the odds at which you placed the bet and the closing odds on the same market. The difference between the two, expressed as a percentage, is your CLV for that wager.
The challenge for UK bettors is practical: most UK sportsbooks do not display historical prop-line movements or closing odds. American-focused platforms are better about publishing closing lines, but UK bettors placing wagers on UK-licensed platforms often need to capture the closing price manually. My approach is to check each bet’s market roughly 30 minutes before game time and record the current odds. That snapshot is not the exact closing line — which is available only at the moment of first pitch — but it is close enough to serve as a reliable proxy over a large sample of bets.
Record the data in a simple spreadsheet with columns for: date, game, prop market, your bet (over/under), your odds, closing odds, CLV percentage and result (win/loss). The CLV percentage is calculated as: (your implied probability minus closing implied probability), where implied probability = 1 / decimal odds. If your odds were 1.95 (implied: 51.3%) and the closing odds were 1.80 (implied: 55.6%), your CLV is 55.6% – 51.3% = +4.3%. You captured positive value — the market agreed your bet was underpriced.
After 100-200 bets, your average CLV begins to stabilise and tells a meaningful story. An average CLV above +1% is strong. Above +3% is exceptional. Below -1% is a warning sign. At -3% or worse, your process is not identifying value ahead of the market, and long-term losses are mathematically likely regardless of short-term results.
Interpreting Your CLV Record Over Time
CLV is a leading indicator; win rate is a lagging indicator. That distinction is why CLV is the more useful tracking metric, especially in the first few months of a prop-betting career when win-rate samples are too small to be statistically significant.
A positive average CLV combined with a losing win rate over a 200-bet sample almost always corrects in the bettor’s favour over time. The prices are right; the results have not caught up yet. Conversely, a negative average CLV combined with a winning win rate is a flashing warning: you are winning despite getting bad prices, which means variance is masking a structural problem in your process.
I review my CLV data monthly, segmented by prop type. Strikeout props might show consistent positive CLV while total bases props show negative CLV, which tells me my analysis is stronger in one market than the other. That segmentation allows me to allocate more volume to the markets where I demonstrate a genuine edge and reduce exposure to markets where the data says I am not beating the closing line.
One common pitfall is confusing CLV with predictive accuracy. CLV measures whether you are getting good prices, not whether your predictions are correct. A bettor can have positive CLV and a losing win rate if the market was simply wrong in both the opening and closing prices — the bettor got a better-than-closing price, but the closing price itself was on the wrong side of the true probability. Over large samples, positive CLV and profitable results converge, but in any single month the two metrics can diverge. Trust the CLV trend over the win-rate trend, and the long-run results will follow.
Closing line value is not glamorous. It will never generate an exciting screenshot or a social-media celebration. But it is the metric that most reliably separates bettors who are profitable because of skill from those who are profitable because of luck — and it is the foundation of the self-assessment process that turns a prop-betting hobby into a sustainable, edge-driven operation.
What is a good closing line value percentage to aim for in MLB prop betting?
An average CLV above +1% across a sample of 200 or more bets indicates that you are consistently capturing prices better than the market’s final assessment. Above +3% is exceptional and strongly predictive of long-term profitability. Between 0% and +1% is marginal — profitable before vig but potentially break-even after it. Below 0% on a sustained basis is a signal that your process is not identifying value ahead of the market.
How do you track closing line value when UK sportsbooks do not display prop line history?
Most UK sportsbooks do not archive prop-line movements, so you need to capture closing prices manually. The practical approach is to check each bet’s current odds roughly 30 minutes before game time and record them in your tracking spreadsheet alongside the odds at which you placed the bet. Over a large sample, this snapshot serves as a reliable proxy for the true closing line. Some third-party odds-tracking tools aggregate line movements from multiple sportsbooks and may offer historical data.
Written by the editors at mlb bet Props.