Pitcher vs Batter History for MLB Prop Betting
 Available in US
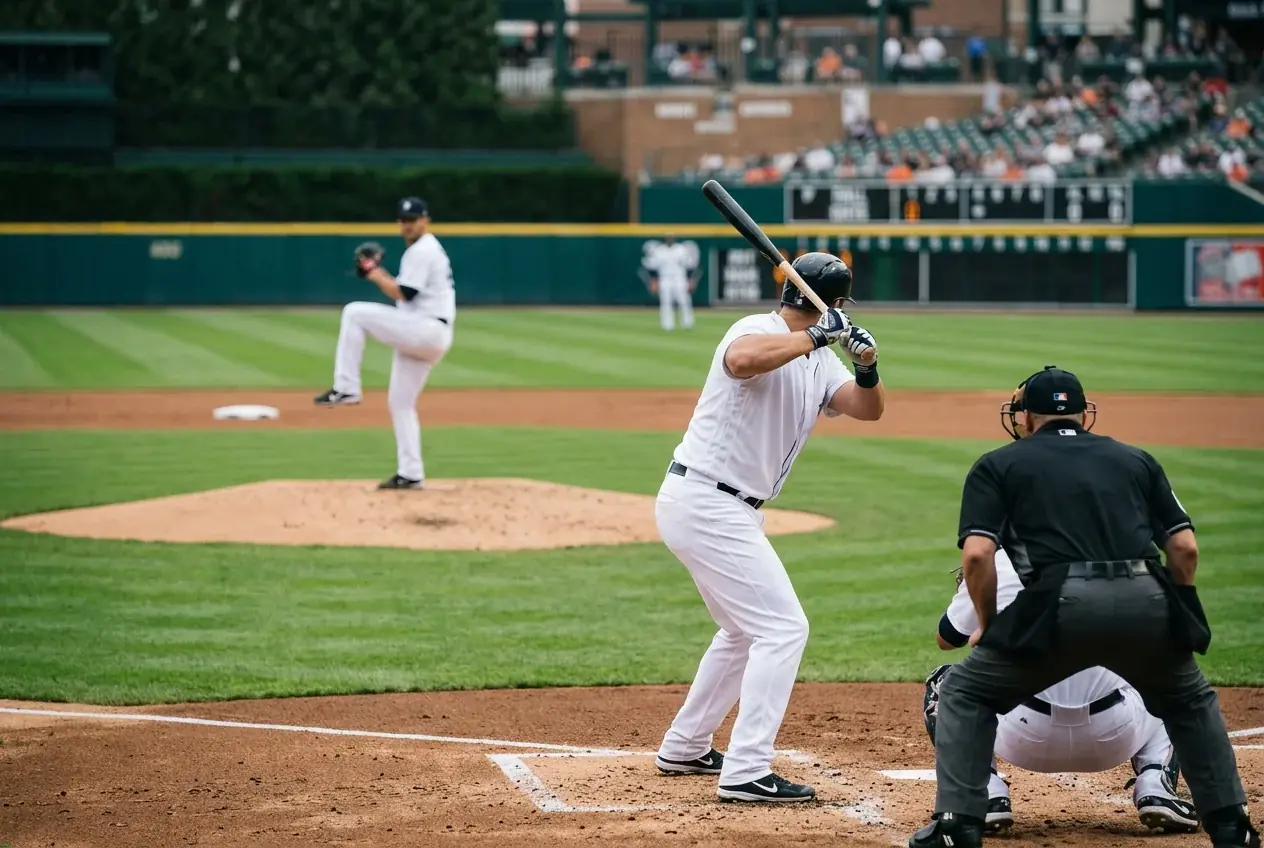
Evaluating Head-to-Head Data for MLB Props
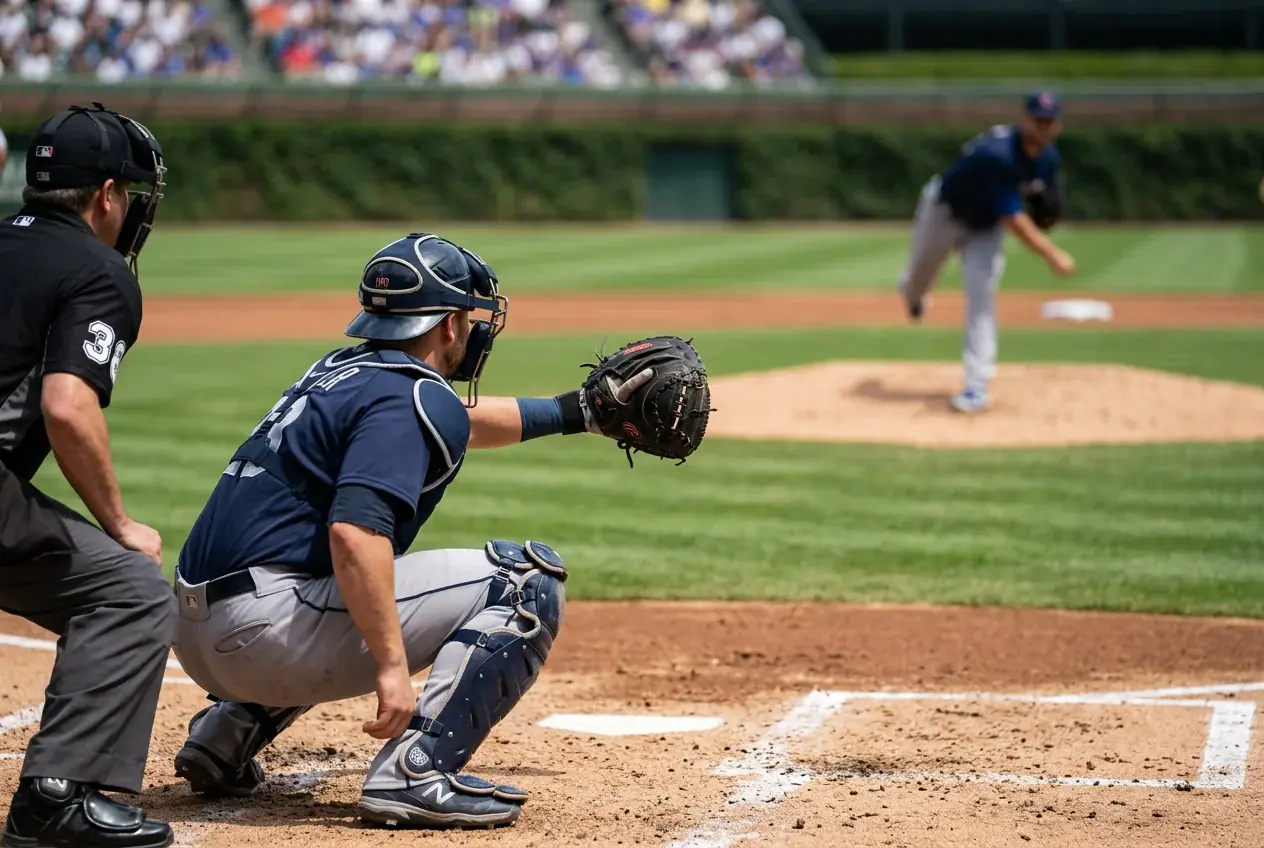
Few things in baseball seduce bettors more than a juicy head-to-head stat line. “This hitter is 8-for-15 against this pitcher with three home runs.” The numbers feel definitive — a clear signal pointing toward the hitter prop over. I fell for it repeatedly in my early years, chasing H2H narratives that looked compelling on paper and turned out to be nothing more than sample-size illusions.
The truth about pitcher-versus-batter data is uncomfortable: most of it is useless for prop betting because the samples are too small to be predictive. A hitter who faces a specific pitcher three or four times per season accumulates 12-16 plate appearances per year. Over three years, that is 36-48 plate appearances — barely enough to draw any statistically meaningful conclusion. And yet, the data is readily available, emotionally persuasive and routinely cited by media and bettors as though it were definitive. Knowing when H2H data actually matters, and when it is noise, is a genuine edge.
How Many At-Bats Make Matchup Data Reliable
The statistical literature on baseball samples is clear: batting outcomes stabilise at different rates depending on the metric. Strikeout rate stabilises fastest, at roughly 60 plate appearances. Walk rate takes about 120. Batting average requires 500 or more before the noise settles down. For head-to-head data, where the sample sizes are inherently small, the relevant question is which metrics are reliable within the number of plate appearances a specific batter-pitcher pair has accumulated.
My threshold is 30 plate appearances as the absolute minimum for any H2H data to inform a prop decision. Below 30, the data is descriptive — it tells you what happened — but not predictive. A hitter who is 9-for-20 against a pitcher looks like he owns the matchup, but 20 plate appearances is so small that the result is dominated by randomness. Flip a coin 20 times and you will frequently see 12 heads and 8 tails, or 7 heads and 13 tails. The same variance applies to batting outcomes at that sample size.
Between 30 and 60 plate appearances, H2H strikeout and walk rates begin to carry some predictive weight. If a hitter has struck out in 40% of 50 plate appearances against a specific pitcher — well above his overall strikeout rate of 25% — that gap is large enough, and the sample is large enough, to suggest a genuine matchup problem. The pitcher probably has a pitch or a sequence that this hitter has not figured out, and that struggle is likely to continue.
Above 60 plate appearances, the data is genuinely useful. Contact quality, batting average and slugging begin to stabilise, and the H2H profile tells you something real about the matchup dynamics. The problem is that very few batter-pitcher pairs in the current era accumulate 60+ plate appearances against each other, because free agency, trades and injuries constantly shuffle the matchup landscape. Division rivals who face each other 13-19 times per season offer the best chance of reaching meaningful samples, but even then, the specific batter-pitcher H2H may only build to 40-50 plate appearances over three years.
Recency vs Career: Weighing Recent Form Against Historical Splits
Even when the sample is large enough to be meaningful, there is a second question: how much should you weight recent results versus career totals?
Players change. A pitcher who dominated a hitter three years ago may have lost a tick of velocity, added a new pitch or shifted his approach in ways that invalidate the historical split. A hitter who was overmatched in 2023 may have adjusted his swing, improved his plate discipline or simply matured into a better hitter by 2026. Career H2H data treats every plate appearance equally, whether it occurred last week or four years ago. That equal weighting can be misleading when one or both players have undergone a meaningful skill change.
I apply a simple recency weight: plate appearances from the current season receive double weight, those from the prior season receive single weight, and anything older is discarded unless the total sample would otherwise fall below 30. This approach prioritises the most relevant data while maintaining enough sample size to avoid the small-number traps. It is imprecise, but precision is not the goal — directional accuracy is.
Context matters too. A hitter who went 0-for-8 against a pitcher in April, when cold weather suppressed offence and the hitter was still finding his timing, may have corrected the problem by June. Stripping the context from the numbers and treating every plate appearance as identical ignores the seasonal dynamics that drive performance. I check the H2H game log — not just the aggregate — to see when the plate appearances occurred and whether recent results diverge from the career average.
Integrating H2H Data Into Prop Selection Without Over-Weighting
The discipline with head-to-head data is to use it as one input among many, not as the primary driver of a prop decision. Only 3-5% of sports bettors are profitable over the long term, and a recurring failure among the other 95% is anchoring on a single compelling data point — like a dramatic H2H split — at the expense of broader analysis.
My process treats H2H data as the final filter, not the first. I begin with the pitcher’s overall metrics (whiff rate, FIP, xERA), move to the batter’s overall quality (wRC+, hard-hit rate, contact rate), factor in the park and weather, check the bullpen and lineup, and then — if I am still interested in the prop — look at the H2H data as a confirming or disconfirming variable.
If the H2H data aligns with the rest of my analysis — the hitter struggles against this pitcher’s pitch mix and the overall metrics support the under — it adds confidence. If the H2H data conflicts with the broader analysis — the hitter is 12-for-30 against this pitcher but the overall metrics strongly favour the under — I trust the broader analysis and discard the H2H narrative. Small-sample H2H data should never override a well-supported conclusion from larger, more reliable datasets.
The one exception is when the H2H data reveals a specific mechanical matchup that the aggregate stats cannot capture. If a pitcher throws a sweeper that this particular hitter cannot touch — 15 plate appearances ending in the sweeper, 12 of them swings and misses — that pitch-specific data is valuable even at a small sample because it identifies a discrete skill mismatch rather than a general trend. These situations are rare, but when they appear, they can tip a borderline prop decision. The key is to verify the matchup through pitch-level data on Baseball Savant rather than relying on the surface-level batting line, which conflates all pitches and counts into a single number that obscures the underlying dynamics.
How many at-bats between a pitcher and batter are needed before the data becomes useful for props?
A minimum of 30 plate appearances is required before head-to-head data carries any predictive weight, and even then, only strikeout and walk rates are somewhat reliable at that sample size. Batting average and slugging require 60 or more plate appearances to begin stabilising. Most batter-pitcher pairs in the modern game accumulate fewer than 50 career plate appearances against each other, which means H2H data should be treated as a supplementary input rather than a primary decision driver.
Should you weight recent matchup results more heavily than career head-to-head numbers?
Yes. Players’ skills evolve over time — pitchers add or lose pitches, hitters adjust their swings — so recent plate appearances are more representative of the current matchup dynamics. A practical approach is to double-weight the current season’s H2H results, single-weight the prior season and discard anything older unless needed to maintain a minimum sample of 30 plate appearances. Checking the game-log context of each H2H result adds further precision.
Published by the mlb bet Props team.