MLB Umpire Strike Zone Props: Scorecard Data Analysis
 Available in US
Using Umpire Scorecards for MLB Prop Bets
Every serious prop bettor has a checklist: pitcher stats, batter matchups, park factors, weather. Almost nobody includes the umpire. That omission is a mistake I made for years before the data forced me to pay attention.
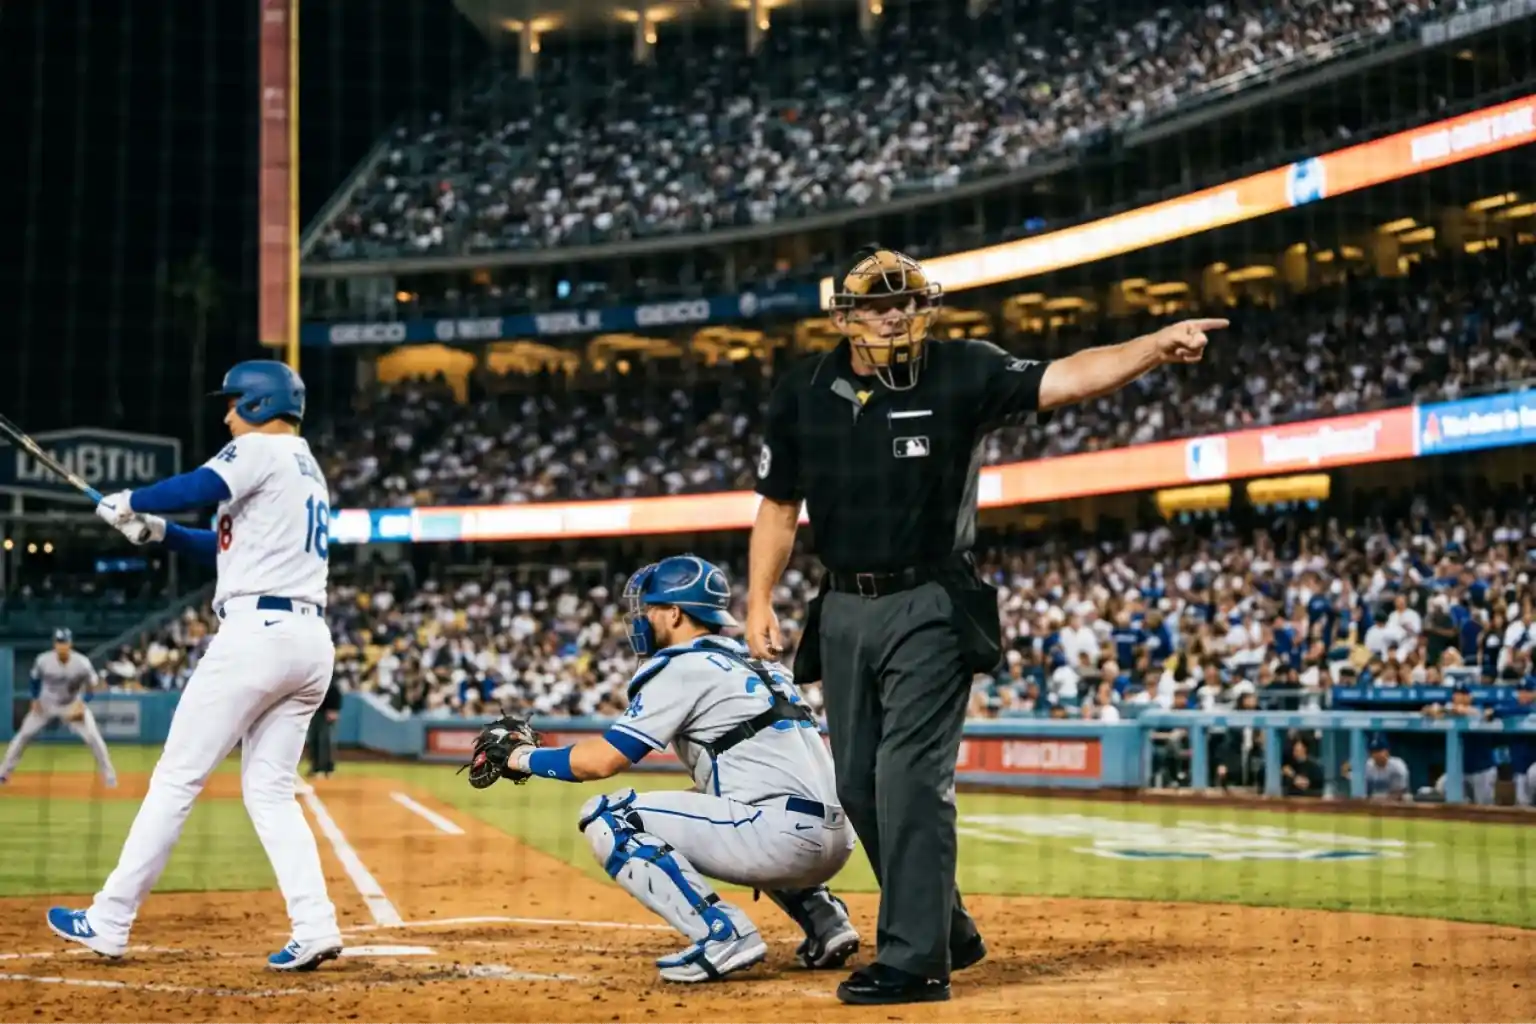
The home plate umpire controls the strike zone, and the strike zone controls everything else. A generous zone expands the pitcher’s effective arsenal, generates more called strikes and drives strikeout totals upward. A tight zone forces pitchers to throw more hittable pitches in the heart of the plate, which suppresses strikeouts and inflates offence. The effect is not subtle — it is measurable, consistent and almost entirely ignored by the prop betting public.
I started incorporating umpire data into my process during the 2022 season and saw an immediate improvement in my strikeout prop accuracy. Not because the data was complicated, but because nobody else was using it. The edge came from being one of the few bettors in my circles who bothered to check which umpire was behind the plate before placing a strikeout or walk wager.
Zone Size Variation and Called-Strike Rate
MLB umpires do not call identical strike zones. The rulebook defines the zone as the area over home plate between the batter’s knees and the midpoint of the torso, but in practice every umpire interprets that rectangle differently. Some expand the bottom of the zone by an inch. Others widen the outside corner. A few run tight zones that compress the effective strike area and force pitchers to attack the middle of the plate.
Called-strike rate — the percentage of taken pitches that the umpire rules as strikes — is the simplest way to quantify an umpire’s zone. League-average called-strike rate hovers around 32-33%. Umpires at the generous end of the spectrum push that number above 36%. Umpires at the tight end sit below 30%. That six-percentage-point spread translates directly into pitcher-prop outcomes because more called strikes mean fewer hitter-friendly counts, more strikeouts and fewer walks.
When I see an umpire with a called-strike rate above 35% assigned to a game featuring a pitcher who already generates a high whiff rate, the strikeout over becomes significantly more attractive. The pitcher’s swing-and-miss ability is supplemented by a zone that gives him free strikes on pitches that a different umpire would call balls. Conversely, when a tight-zone umpire works behind the plate, even elite strikeout pitchers see their totals compressed because batters can take borderline pitches with confidence that they will be called balls.
The data source for this is straightforward: Umpire Scorecards publishes called-strike accuracy and zone-size metrics for every MLB umpire after each game. A five-minute check before placing a prop bet is all it takes to integrate this variable into your process.
Consistency Score: Why It Matters More Than Zone Size Alone
A large zone is helpful for pitchers, but an inconsistent zone is harmful to everyone — and that distinction matters for prop betting in ways that are not immediately obvious.
I learned this the hard way during a Thursday afternoon game where the umpire had a historically large zone but an abysmal consistency rating. I backed the strikeout over expecting the pitcher to benefit from the expanded zone. Instead, the pitcher could not establish a rhythm because the umpire’s calls were unpredictable — a pitch on the outside corner was a strike in the second inning and a ball in the fifth. The pitcher abandoned his best secondary pitch and relied almost exclusively on his fastball, which the opposing lineup timed and punished. He finished with four strikeouts on a line set at 5.5.
Consistency score measures how similarly an umpire calls pitches in the same location across a game. A high-consistency umpire might have a tight zone, but both pitchers and batters can adjust to it because the calls are predictable. A low-consistency umpire creates chaos that disrupts sequencing plans and forces pitchers to aim for the centre of the plate rather than working edges.
For strikeout props, I now weight consistency almost as heavily as zone size. The ideal combination is a large zone with high consistency — the pitcher gets extra strikes, and he can plan around them. The worst combination for strikeout overs is a small zone with low consistency, which turns every at-bat into a lottery. In practice, I filter for umpires who rank in the top third for both zone size and consistency before giving a strikeout over my strongest confidence rating.
Walk props are the mirror image. Umpires with tight, consistent zones produce more walks because batters can comfortably take borderline pitches. Umpires with large, consistent zones suppress walks because pitchers can nibble at the edges and still receive strike calls. If you bet pitcher walk totals — and the market is growing — the umpire assignment is arguably the single most important variable after the pitcher’s own command profile.
Where to Find Umpire Scorecard Data
The good news for UK bettors is that every piece of umpire data you need is free and publicly accessible, regardless of where you are based.
Umpire Scorecards is the primary resource. The site grades every home-plate umpire after each game, publishing accuracy percentages, zone-size estimates, consistency scores and a running season average. I check it each morning as part of my daily research routine. The season averages stabilise after roughly 20 games behind the plate, so by mid-May the data is reliable enough to anchor prop decisions.
Baseball Savant offers a complementary angle. Its pitch-tracking data allows you to filter called strikes and balls by location, giving you a visual map of where a specific umpire tends to expand or compress the zone. If an umpire consistently grants an extra inch on the outside corner to right-handed batters, a pitcher who lives on that edge will benefit disproportionately. That granularity is harder to extract from a single scorecard grade, but the visual maps on Savant make it intuitive.
FanGraphs rounds out the toolkit with umpire-level game logs that include plate-appearance outcomes, strikeout rates and walk rates. Cross-referencing an umpire’s season-long called-strike rate with the strikeout rates of pitchers who have worked in his games gives you an empirical measure of how much the umpire shifts outcomes compared to the league baseline.
None of this data requires a subscription. All three sites are accessible from the UK without restriction, and the combined research time is 10-15 minutes per game card. For a variable that sportsbooks largely ignore in their prop pricing, that is an efficient use of your pre-bet preparation. The umpire does not throw a single pitch, but his calls shape every strikeout prop on the board.
How much can an umpire’s strike zone increase or decrease a pitcher’s strikeout total?
Data from Umpire Scorecards shows that the difference between the most generous and tightest zones in MLB translates to roughly 0.5 to 1.0 additional or fewer strikeouts per game for a starting pitcher. A pitcher with a high whiff rate benefits most from a large zone because borderline pitches that would be balls under a tight-zone umpire are called strikes, putting hitters into unfavourable counts that generate more swing-and-miss outcomes.
Where can UK bettors access free umpire scorecard data for MLB games?
Umpire Scorecards publishes accuracy grades, zone-size estimates and consistency scores for every MLB home-plate umpire after each game. Baseball Savant provides visual pitch-location maps showing where individual umpires expand or compress the zone. FanGraphs offers umpire-level game logs with strikeout and walk rates. All three resources are free and accessible from the UK without restriction.
Prepared by the mlb bet Props editorial staff.