MLB NRFI Picks: First-Inning Betting Odds and Data
 Available in US
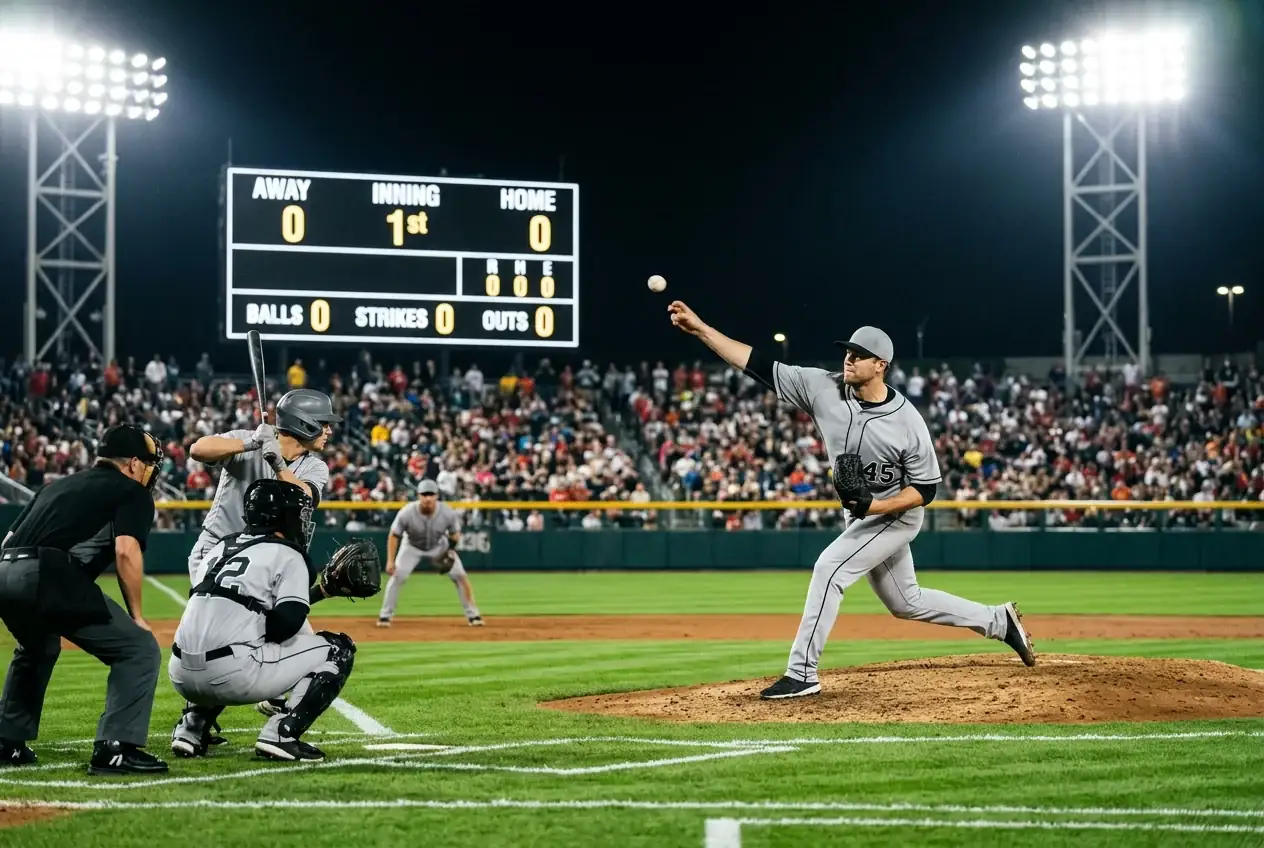
First-Inning Data for MLB NRFI and YRFI Props
Most prop markets ask you to predict what happens over nine innings. NRFI — No Run First Inning — compresses that window into the game’s opening frame, and that compression is precisely what makes it interesting. You are betting that neither team will score a run in the top and bottom of the first inning. The alternative, YRFI, bets that at least one team will. It sounds simple, and the logic is simple, but the evaluation process behind a strong NRFI pick is anything but.
I started tracking NRFI seriously in 2021 and found a pattern that surprised me: the first inning plays differently from every other inning in ways that create genuine, repeatable edges. Starting pitchers face the weakest part of the opposition’s order — the top of the lineup — but they also enter the game fresh, with their full arsenal available and their command at its sharpest. Batters, meanwhile, are seeing the pitcher’s mix for the first time that day. That information asymmetry tilts the first inning toward pitching dominance far more often than the casual fan assumes.
Live and in-play betting now accounts for over 62% of the sports wagering market, and NRFI sits at the fast end of that spectrum — a bet that resolves within 15-20 minutes of first pitch. That speed appeals to bettors who want action without committing to a three-hour outcome window, but it also means you need to do your homework before the game starts. Once the umpire calls “play ball,” there is no time to adjust.
First-Inning ERA and Pitch Sequencing for NRFI
Last June I backed an NRFI on a game featuring two mid-rotation starters, neither of whom had especially impressive season-long numbers. What caught my eye was their first-inning ERA splits — both carried sub-2.00 marks through the opening frame despite posting ERAs north of 4.00 across the full game. That divergence is common, and it is the backbone of any NRFI strategy.
First-inning ERA isolates the pitcher’s performance in the one frame where he is most likely to be sharp. Fatigue has not set in, the pitch count is zero, and the element of surprise is at its peak. Many starters deploy a different sequencing strategy in the first inning compared to later frames — leaning more heavily on their best secondary pitch early to set up fastball counts in subsequent at-bats. That deliberate first-inning approach often translates into suppressed run scoring even from pitchers who struggle in the third time through the order.
The metric to track is straightforward: first-inning ERA over the current season, filtered for a minimum of eight starts to avoid small-sample noise. Anything below 2.50 enters my NRFI candidate pool. Below 1.50, and the pitcher becomes a strong anchor for the bet. But one side is not enough — NRFI requires both starters to keep the first inning clean. So I run the same filter on the opposing starter and only proceed when both pitchers pass the threshold.
Pitch sequencing adds a layer of refinement. Starters who throw their slider or curveball more than 30% of the time in the first inning tend to generate more swings and misses early, which shortens at-bats and reduces the chance of a runner reaching base. FanGraphs and Baseball Savant both offer pitch-usage breakdowns by inning, and I check these splits weekly during the season. A pitcher who has shifted toward a heavier first-inning breaking-ball mix is often worth a second look even if his overall numbers are unremarkable.
Measuring Top-of-Order Aggression for YRFI Angles
The flip side of every NRFI is a YRFI, and the data that disqualifies one often qualifies the other. When I see a lineup whose top three hitters carry a combined first-inning OPS above 0.850, I start thinking about the other side of the market.
Top-of-order aggression is measurable. First-pitch swing rate for the leadoff hitter, on-base percentage in the first inning for the two-hole batter, and slugging in the opening frame for the three-hitter — these splits exist and they vary wildly from one lineup to another. Some teams are engineered to attack early: they send a high-contact leadoff man to set the table, follow with a disciplined hitter who works counts and gets on base, and slot a power bat third to drive runs in. Other teams stack their lineup for middle-inning damage and treat the first inning as a scouting exercise. The difference between those two philosophies is quantifiable, and it matters for NRFI pricing.
I keep a rolling spreadsheet of each team’s first-inning scoring frequency, updated weekly. League-wide, roughly 28-30% of first innings produce at least one run. Teams at the aggressive end of the spectrum push that rate above 35%. Teams with patient, low-aggression top orders sit closer to 22-25%. When two aggressive first-inning teams meet a pair of mediocre starters, the YRFI side carries genuine value. The books know this too, of course, but their lines are set using models that weight season-long data, and first-inning aggression tends to cluster in streaks that the models are slow to capture.
When YRFI Becomes the Sharper Side
NRFI gets most of the public attention because recreational bettors love the simplicity of rooting for a scoreless frame. That popularity skews the line. When the public loads one side, the book adjusts, and sometimes the value migrates entirely to YRFI.
Only 3-5% of sports bettors are profitable over the long term, and a significant reason for that is the tendency to follow public narratives rather than data. The public loves backing two aces in an NRFI, but the line on that matchup is often juiced to the point where the implied probability exceeds the actual probability by three or four percentage points. Meanwhile, the YRFI line on a game featuring two back-end starters with shaky first-inning numbers might be sitting at a price that understates the true scoring probability.
I flip to YRFI when three conditions align: at least one starter carries a first-inning ERA above 4.00 over ten or more starts, the opposing top of the order ranks in the upper third of the league for first-inning OPS, and the YRFI line implies a probability below 40% despite the data suggesting something closer to 45-48%. That gap is where the value lives. It does not hit every night, but over a season of 162 games per team, the opportunities accumulate. The key is discipline — resisting the urge to bet NRFI or YRFI on every game and waiting for the data to align. First-inning props reward precision, not volume, and the bettor who treats them as a data-driven exercise rather than a coin flip will outperform the one who treats them as entertainment.
What first-inning ERA threshold makes a pitcher a reliable NRFI candidate?
A first-inning ERA below 2.50 over a minimum of eight starts is a useful entry threshold. Pitchers below 1.50 in the first inning are strong NRFI anchors. Both starters in the game must pass the filter for an NRFI bet to qualify, since a single run from either side loses the wager.
How do YRFI props differ from NRFI in terms of value and variance?
YRFI props carry higher variance because they require a specific positive event — at least one run in the first inning — rather than the absence of one. However, public money tends to favour NRFI on marquee pitching matchups, which can push YRFI lines to prices that understate the true scoring probability. YRFI value surfaces most often when back-end starters face aggressive top-of-order lineups.
Prepared by the mlb bet Props editorial staff.