MLB Strikeout Props: Pitcher Metrics, Matchup Reads and Line Selection
Table of Contents
- What Makes Strikeout Props the Most Data-Rich Market in Baseball
- The Five Pitcher Metrics That Drive Strikeout Lines
- Reading Batter Matchups: Platoon Splits and Lineup Stacking
- Evaluating and Comparing Strikeout Lines Across UK Books
- Strikeout Prop Trends Across the MLB Season
- Three Mistakes UK Punters Make with Strikeout Props
- Strikeout Props: Key Questions Answered
What Makes Strikeout Props the Most Data-Rich Market in Baseball
I remember the exact moment strikeout props clicked for me. It was a midweek Guardians game in 2019, and I had spent forty minutes cross-referencing a starter’s swinging-strike rate against a lineup stacked with free-swinging right-handers. The line was set at 5.5 Ks at 1.87. He fanned eight. That was not luck — it was the logical outcome of measurable inputs feeding into a predictable output. No other prop market in baseball hands you that kind of analytical runway before first pitch.
The reason is structural. A strikeout is the cleanest individual event in the sport — one pitcher against one batter, repeated across five to seven innings, with no defensive interference. Compare that to a home run prop, where park dimensions, wind speed and sheer variance all muddy the picture, or a hits prop where a soft grounder finding a hole counts the same as a line drive. Strikeouts strip away the noise. The pitcher either misses the bat, freezes the hitter, or does not. And every variable that influences that outcome is tracked, catalogued and publicly available.
Player props now account for roughly 70-75% of all bets placed in the same-game parlay category, and strikeout overs sit comfortably among the most popular legs. Karl Danzer, SVP of Odds Services at Sportradar, put it well when he said sport has become more personality-led and that this shift plays a significant role in how people bet. For UK punters navigating MLB prop markets for the first time, strikeout props are the ideal entry point — not because they are simple, but because they are the most researchable. Every metric I will walk through in this guide is free, public and updated in near real-time. You just need to know where to look and what matters.
This guide breaks down the five pitcher metrics that drive strikeout lines, explains how to read batter matchups and umpire data, walks through line-shopping strategy across UK-licensed books, and flags the seasonal patterns that shift K-totals from April through October. If you are serious about building an edge in MLB props, strikeout markets are where you start.
The Five Pitcher Metrics That Drive Strikeout Lines
Not all strikeout pitchers are built the same, and the line you see at your sportsbook is a compression of dozens of data points into a single number. Over nine years of breaking down pitcher props, I have narrowed the noise to five metrics that consistently predict whether a starter will clear his strikeout line. Miss any one of them and you are flying blind.
Swinging-Strike Rate
This is the percentage of total pitches that produce a swing and a miss. League average hovers around 11%. Once a pitcher sits above 12%, he is generating whiffs at a rate that reliably translates to elevated K-totals. Above 14% and you are looking at an elite miss-bat artist — think of the arms who consistently post 8-plus strikeouts per start. I treat swinging-strike rate as my first filter. If a pitcher is below 10.5%, I rarely bother looking deeper into his K-prop unless the opposing lineup is unusually aggressive.
Called-Strike-Plus-Whiff Rate (CSW%)
Swinging-strike rate only captures one pathway to a strikeout. CSW% adds called strikes — pitches where the batter watches a ball cross the zone without offering. A pitcher who commands the edges of the plate accumulates called strikes that set up whiffs later in the count. League average CSW% sits around 28-29%. Above 31% is strong, and above 33% is elite territory. The beauty of CSW% is that it captures both control-based strikeout pitchers (who freeze hitters looking) and power arms (who blow fastballs past them).
K/9 (Strikeouts Per Nine Innings)
The most intuitive metric, and the one sportsbooks lean on most heavily when setting lines. K/9 tells you how many strikeouts a pitcher records per nine innings pitched. The league average is roughly 8.5 K/9. A starter above 10.0 K/9 is in the upper tier. But K/9 alone is deceptive — it is a counting stat that does not distinguish between a pitcher who strikes out weak lineups in blowouts and one who fans elite hitters in tight games. That is why I use K/9 as a baseline, not a verdict. It tells me the range a pitcher operates in. The other four metrics tell me whether he will hit the top or bottom of that range on a given night.
First-Pitch Strike Percentage
Getting ahead in the count changes everything. When a pitcher throws a first-pitch strike, the at-bat is roughly twice as likely to end in a strikeout compared to when the first pitch is a ball. League average first-pitch strike percentage runs around 60%. Pitchers above 64-65% consistently control the strike zone early, which extends at-bats into strikeout-friendly counts (0-2, 1-2). I pay particular attention to this metric for control-oriented starters who lack high-end velocity but pile up Ks through sequencing and command.
Chase Rate Induced
Chase rate measures how often a pitcher gets batters to swing at pitches outside the strike zone. League average sits around 28-29%. Elite pitchers with devastating breaking balls or off-speed weapons push above 33%. This metric matters most for pitchers who rely on a single dominant secondary pitch — a slider that sweeps off the plate, a changeup that drops below the zone. High chase rate combined with high swinging-strike rate is the strongest predictive pairing for strikeout props. When both metrics are above their respective 75th-percentile thresholds, I size my stake up.
None of these metrics works in isolation. A pitcher with elite swinging-strike rate but poor first-pitch strike percentage will fall behind in counts and never reach the deep-count situations where strikeouts happen. A pitcher with high CSW% but low chase rate induced is getting called strikes in the zone but not expanding — hitters put the ball in play instead of chasing. The edge is in the combination. When three or more of these five metrics sit above the 70th percentile, the strikeout prop line is almost always worth a closer look.
Reading Batter Matchups: Platoon Splits and Lineup Stacking
A brilliant pitching profile means nothing if the opposing lineup does not cooperate. I learned this the hard way backing a right-handed flamethrower against a lineup that had quietly stacked four patient left-handed hitters into the top five. He threw 98 mph with a wipeout slider — and recorded four strikeouts in six innings because those lefties laid off his chase pitch all night. The matchup ate the metric edge alive.
Platoon splits are the starting point. Right-handed pitchers, as a group, strike out right-handed batters at a higher rate than left-handed batters, and the reverse holds for left-handed pitchers. The differential is not trivial — it can swing a strikeout rate by 15-20% depending on the pitcher’s repertoire. A righty with a dominant slider struggles to generate the same movement against lefties who see the pitch break toward them rather than away. When you see a lineup card loaded with same-side hitters against a starter whose platoon split is extreme, the K-prop becomes significantly more attractive.
But platoon data only tells half the story. Lineup stacking — the order and composition of the batting order — shapes how many plate appearances a starter faces and against whom. A lineup that bats its highest-contact hitters at the top (positions one through three) forces the starter into shorter, more efficient at-bats early. That means fewer deep counts, fewer whiffs, and a lower chance of clearing a strikeout line set at 6.5 or higher. Conversely, a lineup that features aggressive, high-strikeout hitters in the heart of the order (positions three through six) creates more opportunities for the pitcher to rack up Ks in high-leverage at-bats.
I always check the opposing team’s lineup-level strikeout rate against the specific handedness of the starting pitcher. If a team strikes out 26% of the time against right-handed pitching and tonight’s starter is a righty with above-average whiff metrics, the conditions stack. If that same team strikes out only 20% of the time against righties, the prop line needs to be significantly more generous before I get involved.
One more angle worth mentioning: rest-day lineups. MLB teams increasingly rest regulars during day games following night games, particularly in the middle of long road trips. The replacement hitters — utility players, defensive specialists — tend to carry higher individual strikeout rates. These lineup changes often are not reflected in the prop line until close to game time. If you check lineups as soon as they are posted (usually 3-4 hours before first pitch) and spot a weakened batting order, you can grab a strikeout over before the line adjusts. For a contrasting approach that focuses on the batter side of the equation rather than the pitcher side, the home run props guide covers how Statcast power metrics shape batter-focused props.
Umpire Strike Zones and Their Measurable Effect on K-Totals
Here is a variable that almost nobody in the UK betting scene talks about, and it genuinely baffles me. The home plate umpire controls the strike zone, and umpires are not consistent. Some call a generous zone that expands two inches off the outside corner. Others squeeze the zone tight, forcing pitchers to throw hittable strikes. The difference between a generous umpire and a tight one can shift a starting pitcher’s expected strikeout total by a full strikeout — sometimes more.
Umpire scorecards, published daily by independent analysts who track every called pitch against the actual strike zone, quantify this variance. Two numbers matter most: zone size (measured in square inches above league average) and consistency score (how often the umpire makes the correct call on borderline pitches). A large-zone umpire with high consistency inflates strikeout totals because pitchers can work the edges confidently. A small-zone umpire with low consistency creates chaos — pitchers fall behind in counts because borderline pitches get called balls, and hitters benefit from expanded patience.
I integrate umpire data as a final adjustment after evaluating the pitcher profile and the opposing lineup. If everything else points to a strikeout over but the assigned umpire ranks in the bottom quartile for zone size, I either skip the bet or require a longer line (6.5 instead of 5.5, for instance). Conversely, a top-quartile zone-size umpire can push a borderline play into value territory.
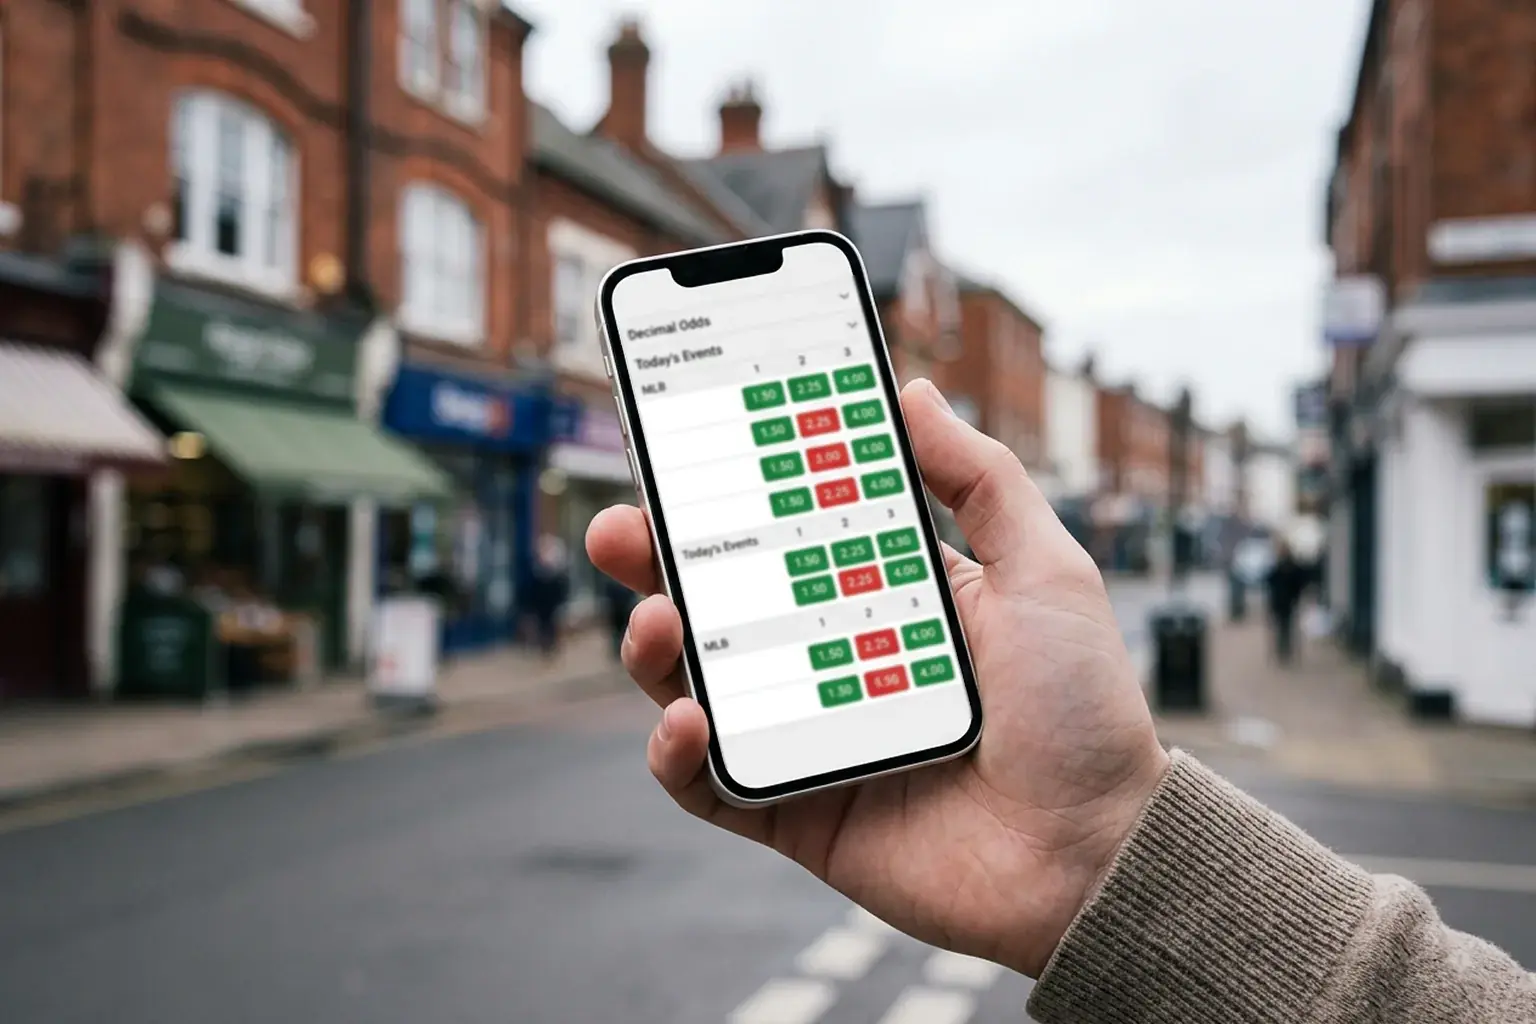
Evaluating and Comparing Strikeout Lines Across UK Books
Two sportsbooks can list the same pitcher’s strikeout prop at the same number and still offer wildly different value. I have seen a 5.5 K line priced at 1.83 on one platform and 1.95 on another for the same game. Over a full MLB season of 162 game days, that kind of discrepancy compounds into a measurable difference in long-term returns. The gross win margin for operators sat at 9.3% across the industry in 2024, up from 7.0% in 2019 — which means the vig baked into prop lines has been creeping upward. Line-shopping is how you claw some of that margin back.
UK-licensed books vary in their MLB prop coverage. The larger international operators tend to list strikeout props for most scheduled starters, though the range narrows for less high-profile matchups. Smaller UK books might only cover marquee pitchers or nationally televised games. Before settling on a single platform for MLB props, check the breadth of coverage across three or four books during a typical Tuesday slate — that is when the schedule is fullest and the coverage gaps become obvious.
Beyond the price itself, pay attention to when lines are posted. Some books release MLB props early in the morning UK time (before US lineups are confirmed), while others wait until lineups lock. Early lines can offer value if you have already done your research on likely lineup configurations, but they also carry the risk of a late scratch or lineup change that shifts the prop’s underlying probability. I prefer to bet after lineups are confirmed but before the broader market has fully adjusted — a window that typically runs from about 5:00 PM to 6:30 PM UK time for a standard 11:00 PM ET first pitch.
One practical tip: always compare the alternative line. If one book offers 5.5 Ks at 1.85 and another offers 6.5 Ks at 2.30, run the expected value on both. Sometimes the higher line at longer odds represents better value than the lower line at shorter odds, particularly for elite strikeout pitchers facing weak lineups where the upside scenario is 8-9 Ks.
Strikeout Prop Trends Across the MLB Season
The MLB season is not one market — it is six or seven distinct markets stitched together across 162 games, and strikeout props behave differently in each phase. Ignoring this is like using the same tyre compound in Monaco and Silverstone. The conditions change and your approach has to change with them.
April and early May favour pitchers heavily. Hitters are still calibrating their timing after spring training, cold temperatures in northern cities suppress bat speed, and pitchers are fresh with full-strength arms. Strikeout rates across the league tend to peak during this window. The practical implication is that oddsmakers know this too, so April K-lines are generally set higher than the same pitcher would see in July. The value play in April is not blindly hammering overs — it is identifying pitchers whose early-season form exceeds their line adjustments, particularly starters returning from injury whose pitch counts are not yet capped.
Summer — June through August — flips the dynamic. Hitters settle into rhythm, the ball carries better in warm air, and pitchers accumulate fatigue. League-wide K/9 tends to dip from its April peak. But within that decline sit opportunities. Pitchers who maintain their swinging-strike rate through the summer, while their peers fade, become disproportionately valuable for strikeout props because the lines may not fully reflect their sustained dominance. MLB generates over $12 billion in annual revenue, and the summer stretch — when attendance peaks and TV viewership spikes — is when sportsbooks push the broadest prop menus. More markets mean more soft lines to find.
September brings expanded rosters and playoff races. Contending teams ride their aces hard, sometimes on short rest, which can suppress strikeout totals as fatigue accumulates. Meanwhile, eliminated teams deploy young call-ups from the minors — hitters who have never seen big-league breaking balls and are prone to chasing. If you can identify a strong starter facing a September lineup loaded with rookies, the K-over can be one of the highest-probability plays of the entire season.
The postseason, if your book offers it, is its own beast. Smaller sample sizes, heightened adrenaline, and unfamiliar matchups between pitchers and hitters from different leagues create volatility. I tend to reduce my unit size in October but increase my research depth per bet.
Three Mistakes UK Punters Make with Strikeout Props
After years of discussing MLB props with fellow bettors in the UK, the same errors keep surfacing. They are not unique to British punters, but the distance from the sport — fewer live broadcasts, less cultural familiarity — makes them stickier on this side of the Atlantic.
The first mistake is chasing name recognition. A high-profile pitcher with a 95 mph fastball and a highlight-reel slider feels like an automatic K-over play. But sportsbooks price name value into the line. The line on a marquee ace is set where it is precisely because the market expects him to dominate. The edge rarely lives with the obvious aces — it lives with the mid-tier starters whose swinging-strike rate has quietly ticked up over the past three weeks while the line has not moved. Only 3-5% of sports bettors are profitable long-term, and the ones who survive are not betting the names everyone knows at the prices everyone sees.
The second mistake is ignoring pitch count and workload management. Modern MLB managers pull starters earlier than ever. A pitcher who averages 6.2 innings per start and 22 batters faced has a fundamentally different K-ceiling than one who averages 5.0 innings and 19 batters faced. If a line is set at 6.5 Ks but the pitcher rarely sees more than 20 batters in a game, the arithmetic is punishing — he would need to strike out roughly one in three batters faced, which is elite-level performance even for the best arms. Always check average batters faced per start alongside K/9.
The third mistake is treating every strikeout prop as an over-or-nothing decision. Unders get a bad reputation because they feel like betting against excitement, but they are the right play more often than most punters admit. When a high-K pitcher faces a contact-oriented lineup with a low team strikeout rate, or when a starter is coming off a heavy workload and the manager has hinted at an early hook, the under at plus-money can carry genuine expected value. For a breakdown of the break-even maths, note that at standard -110 pricing you need a 52.38% win rate just to stay flat. That threshold applies equally to overs and unders — the market does not care which direction you pick, only whether your probability estimate is accurate.
Strikeout Props: Key Questions Answered
How does a pitcher’s whiff rate predict strikeout prop outcomes?
Whiff rate — also called swinging-strike rate — measures the percentage of pitches that produce a swing and miss. Pitchers above 12% consistently generate strikeouts at above-average rates, because every whiff advances the count toward a punchout. When whiff rate is combined with a high chase rate induced (above 33%), the probability of clearing a strikeout line rises sharply. I treat the pairing of these two metrics as the single strongest predictor in my workflow.
Should you take the over on strikeout props for power pitchers facing weak lineups?
Not automatically. Power pitchers facing high-strikeout lineups are the most obvious K-over play, and sportsbooks price them accordingly. The line will be set high enough to account for the favourable matchup, which compresses the value. The better approach is to compare the pitcher’s expected strikeout rate against the specific lineup to the implied probability embedded in the line. If the lineup-adjusted projection exceeds the implied probability by 5% or more, the over carries positive expected value regardless of how obvious the matchup appears.
How do bullpen usage and pitch counts affect strikeout totals?
Pitch count limits directly cap the number of batters a starter faces, which limits strikeout opportunities. A starter restricted to 85 pitches will typically face 19-21 batters, making a line of 6.5 Ks extremely difficult to clear. Beyond the starter, bullpen context matters indirectly — if a manager plans to go to the bullpen early because relievers are rested, he may pull the starter before he reaches deep counts in the sixth or seventh inning. Check average pitches per start and recent manager comments on workload management before backing a K-over.
Which UK sportsbooks offer the best strikeout prop lines for MLB?
Coverage varies by operator and by slate. The larger international books licensed by the UK Gambling Commission tend to list strikeout props for most scheduled starters on full-slate days, though coverage thins for afternoon games and less prominent matchups. Rather than relying on a single platform, maintaining accounts across three or four operators lets you compare prices and grab the best number on any given night. Line discrepancies of 0.10 to 0.15 in decimal odds are common and compound meaningfully over a full season.
Created by the ”mlb bet Props” editorial team.